Python package and desktop application · BSD-3-Clause
spaCR
Spatial phenotype analysis of CRISPR-Cas9 screens.
spaCR segments cells, nuclei and pathogens in microscopy images, measures every object, and links the measurements to the guide RNAs sequenced from the same wells. It starts from plate images and FASTQ reads and ends with per-cell measurements, trained classifiers and a ranked list of genes.
- Version 1.5.1.4
- Released 2026-10-09
- Python 3.9–3.14
Pipeline
One field followed through spaCR: plate 1, well H02, field 4 of the example screen, a well whose guides are 92% GRA14, the positive control.
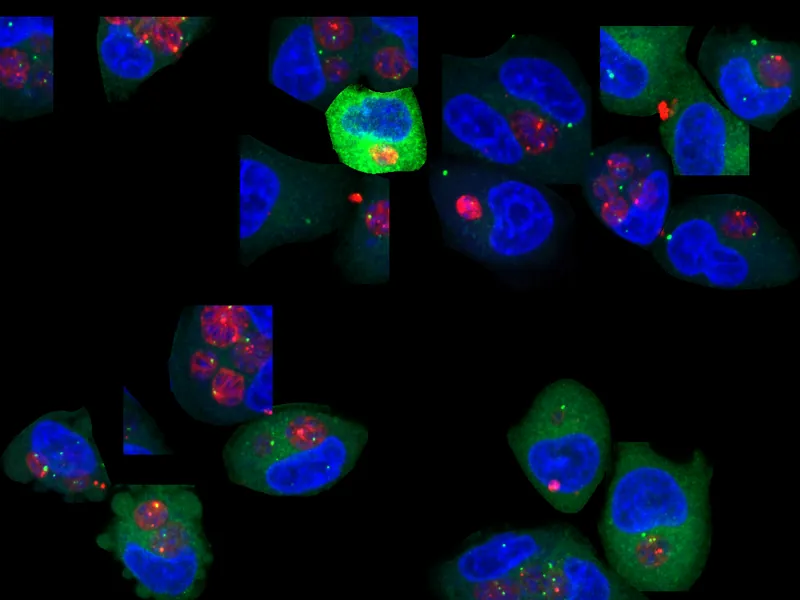
1Image
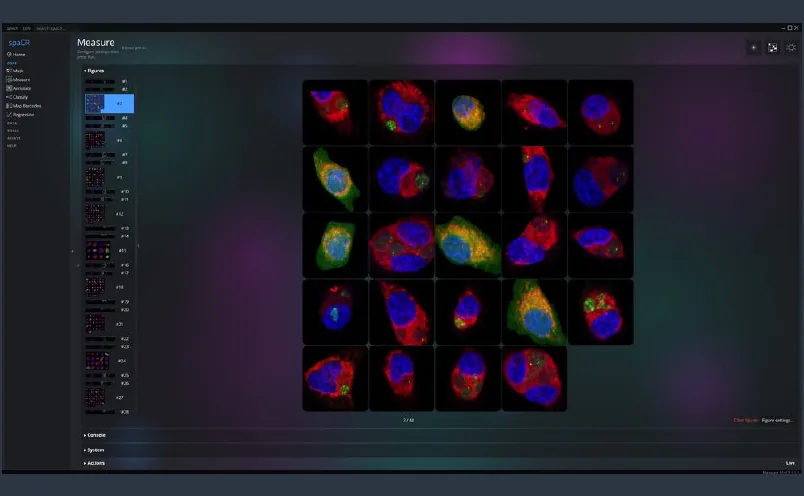
19 infected cells, reassembled from Measure crops.
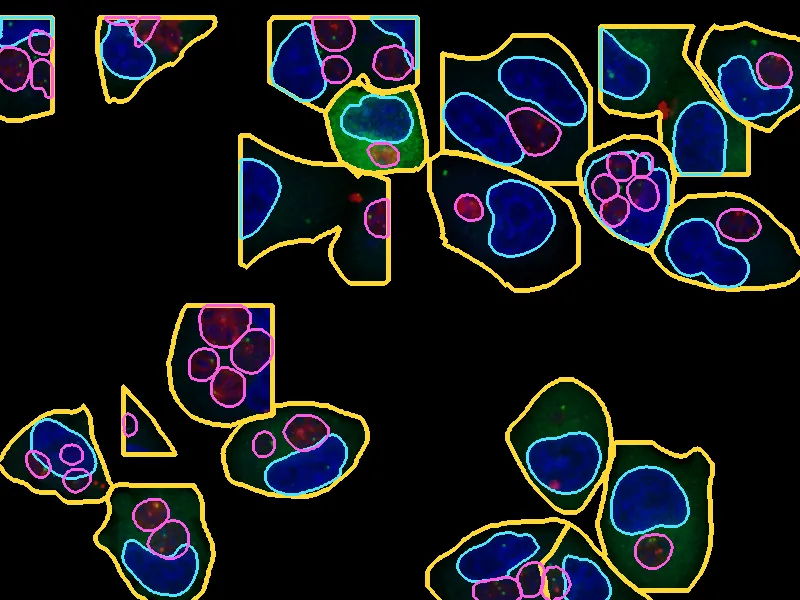
2Mask
Cell, nucleus and parasite outlines.
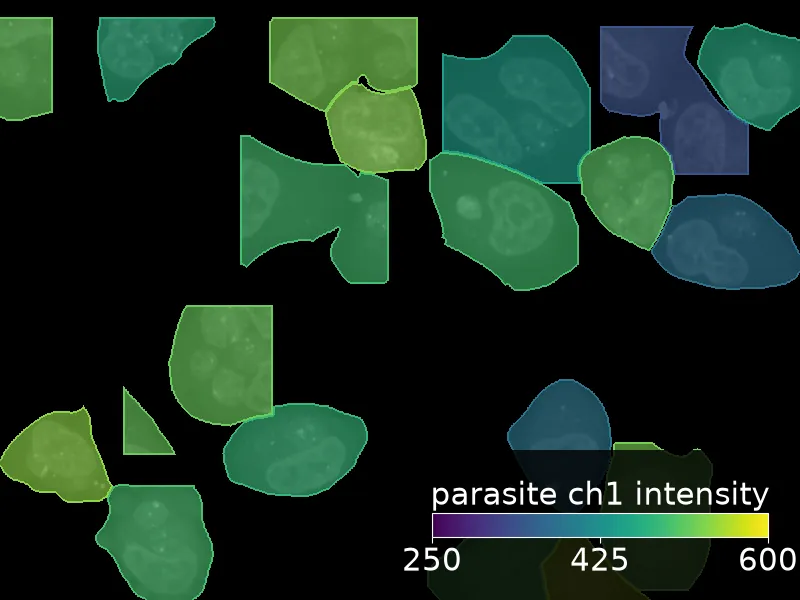
3Measure
Cells coloured by parasite channel-1 intensity.
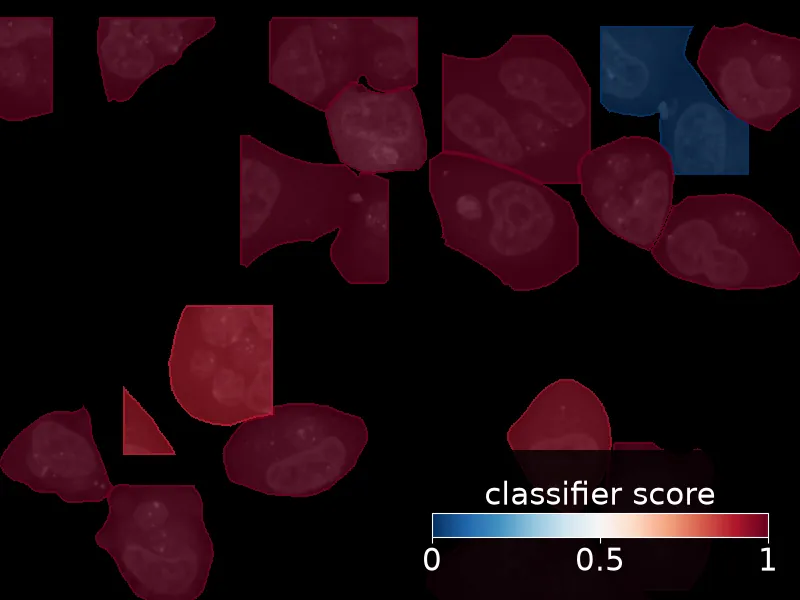
4Classify
Classifier score per cell; 18 of 19 above 0.5.
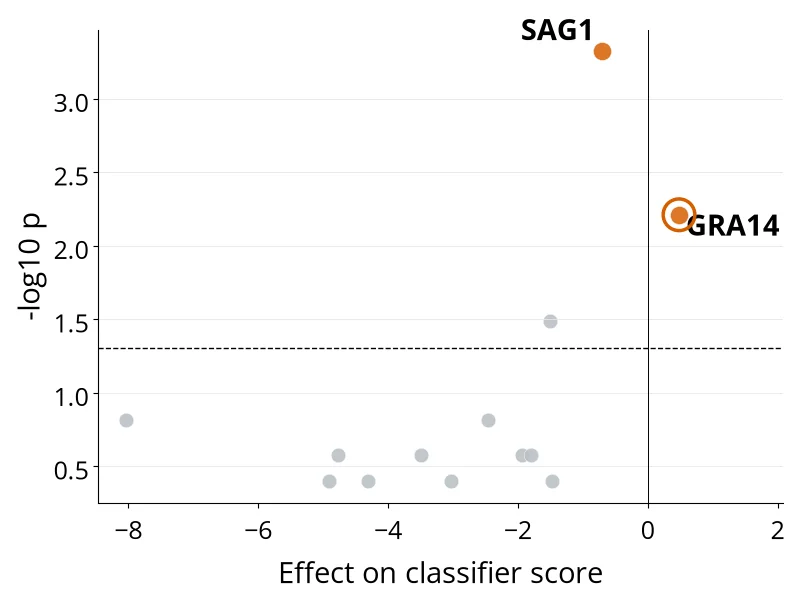
5Hit
GRA14 called by regression (q 0.040).
Data: spacr-example-screen crops and spacr-example-hit measurements, scores and guide counts. Cell outlines are the screen's masks; nucleus and parasite outlines were recomputed with Cellpose-SAM through spaCR on CPU; the regression covers this 30-well subset.
- MaskSegments cells, nuclei, pathogens and organelles with Cellpose models.
- MeasureShape, intensity, texture and position of every object, and a crop of each, in SQLite.
- AnnotateLabels object crops in a grid with keyboard shortcuts.
- ClassifyTrains image or measurement classifiers and stores held-out performance with each checkpoint.
- Map barcodesAssigns sequencing reads to wells and guide RNAs.
- RegressionEstimates guide, gene and condition effects with intervals and a ranked hit list.
Published models
Each figure shows one real image and the objects that spaCR's published models detect in it. Drag the divider to compare the input with the outlines, and use the check boxes to show or hide a class. Counts are objects in the image shown. Weights resolved through spaCR's model zoo (nightly, 2026-10-10) and run with Cellpose 4.2.1.1 on CPU.
- 16published models
- 4cross-channel models
- 7object classes shown
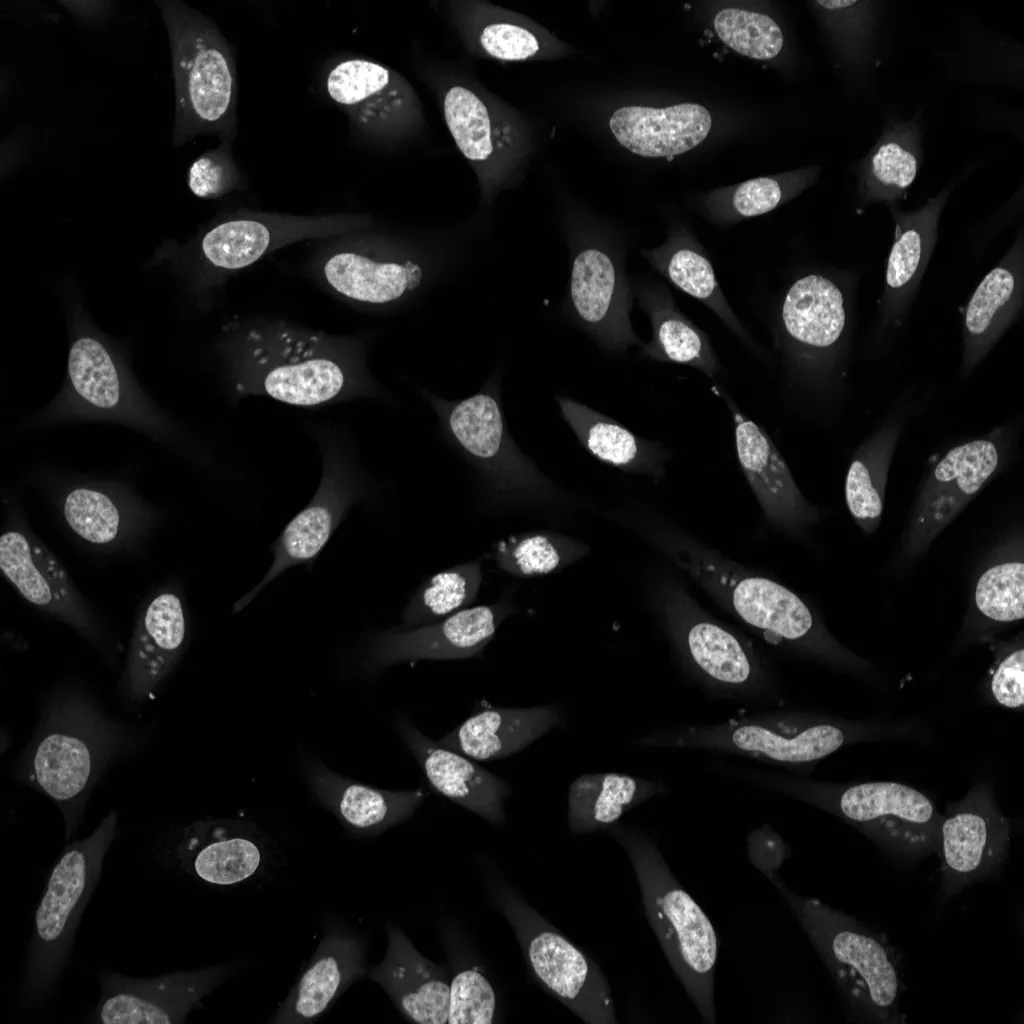
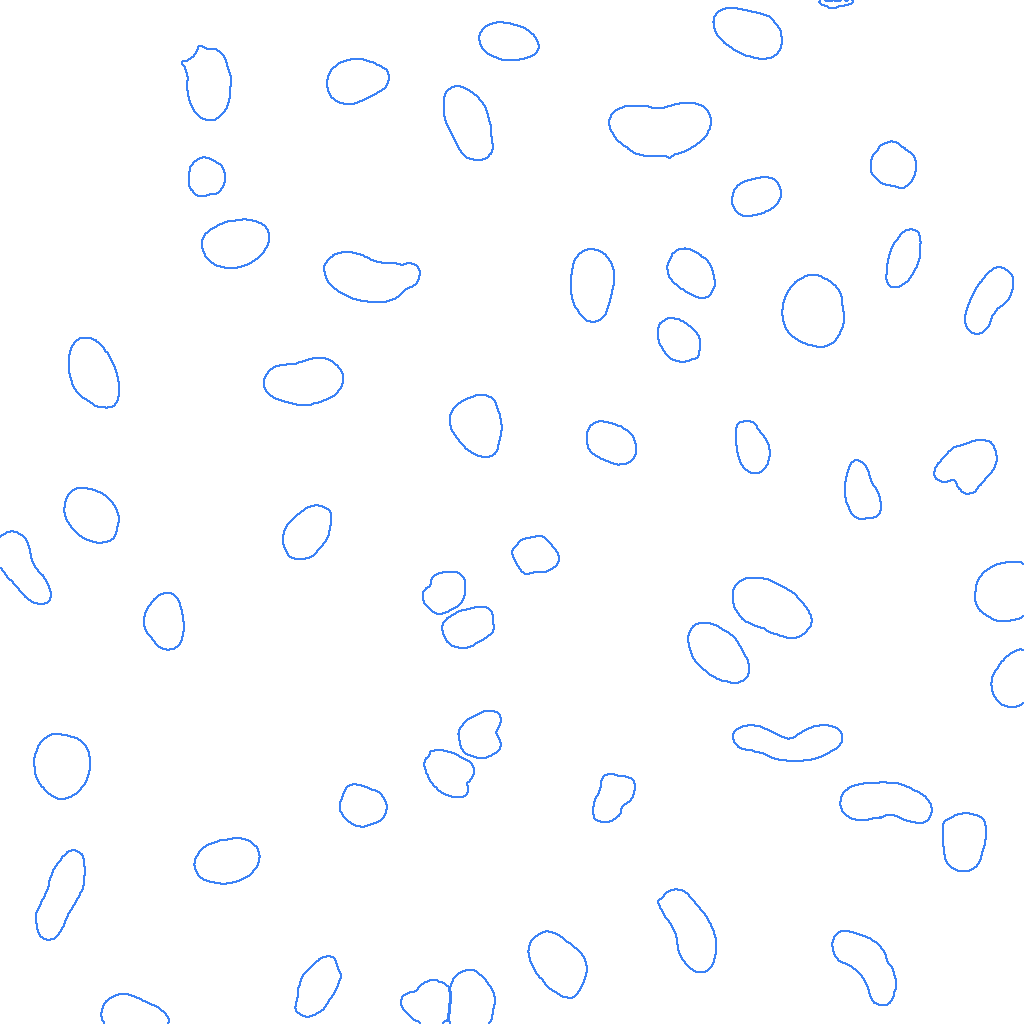
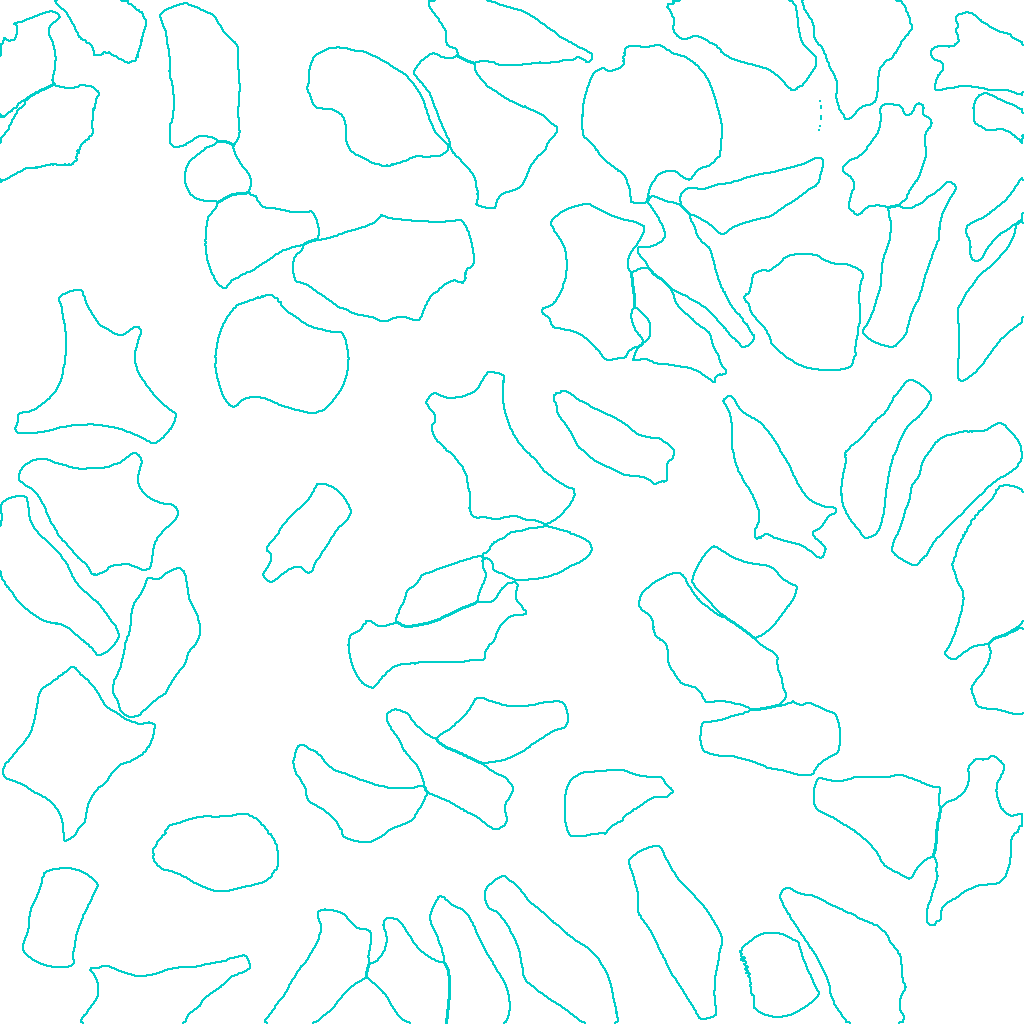
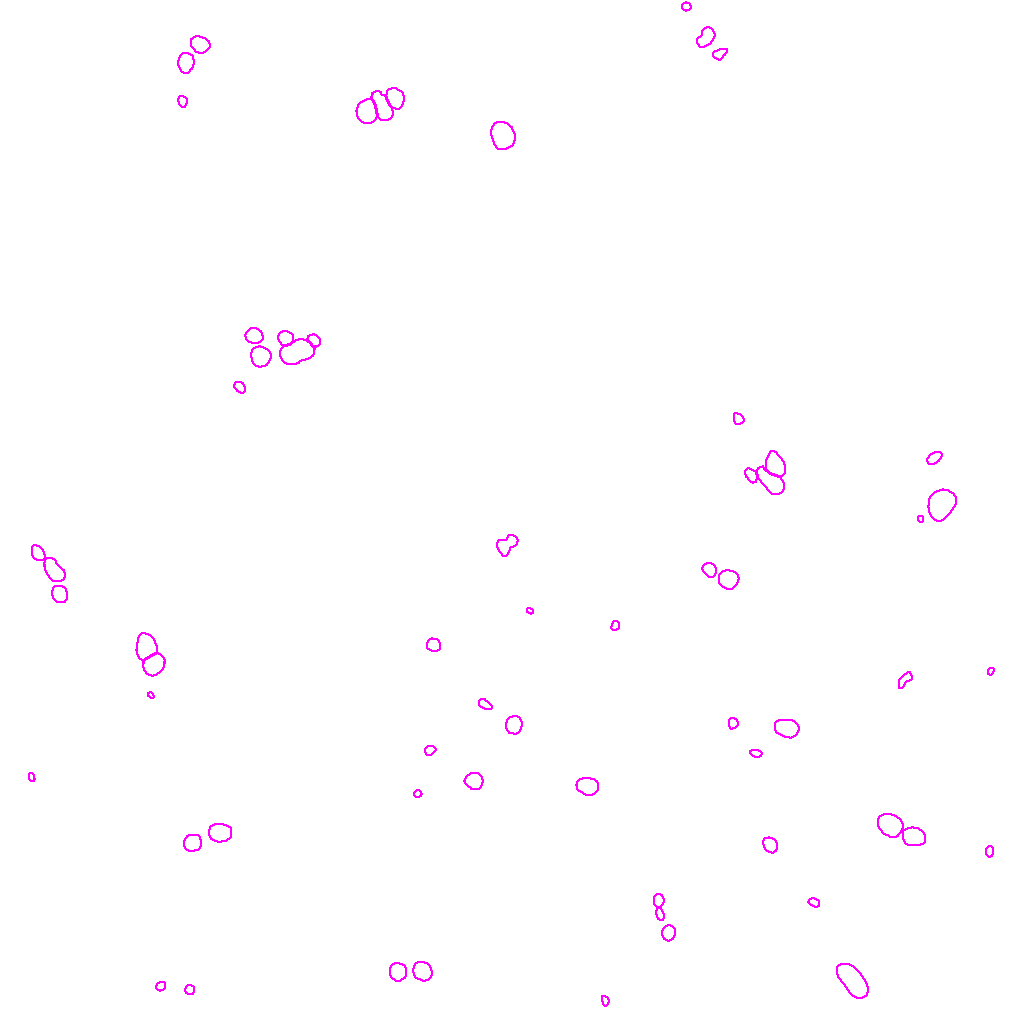
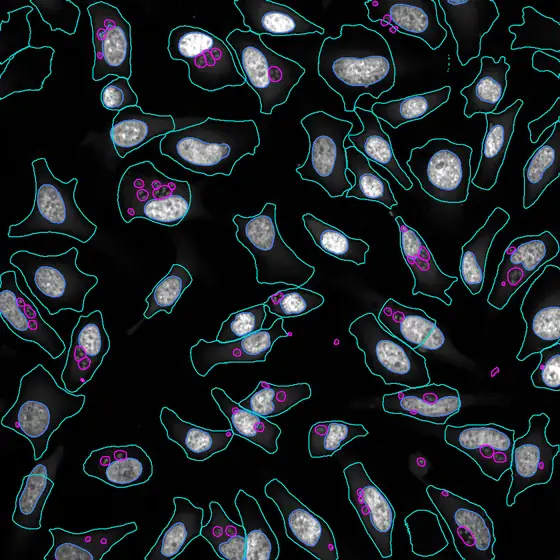
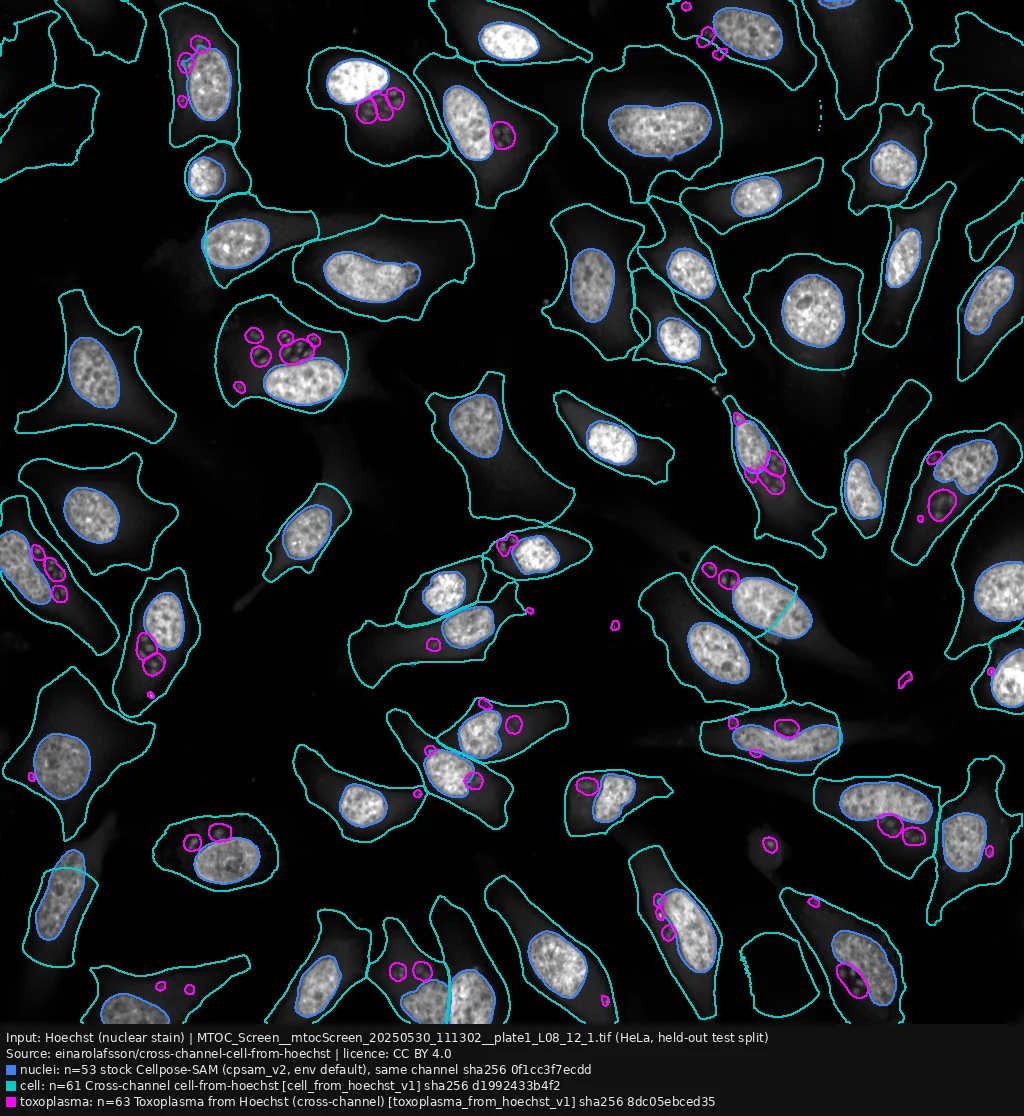
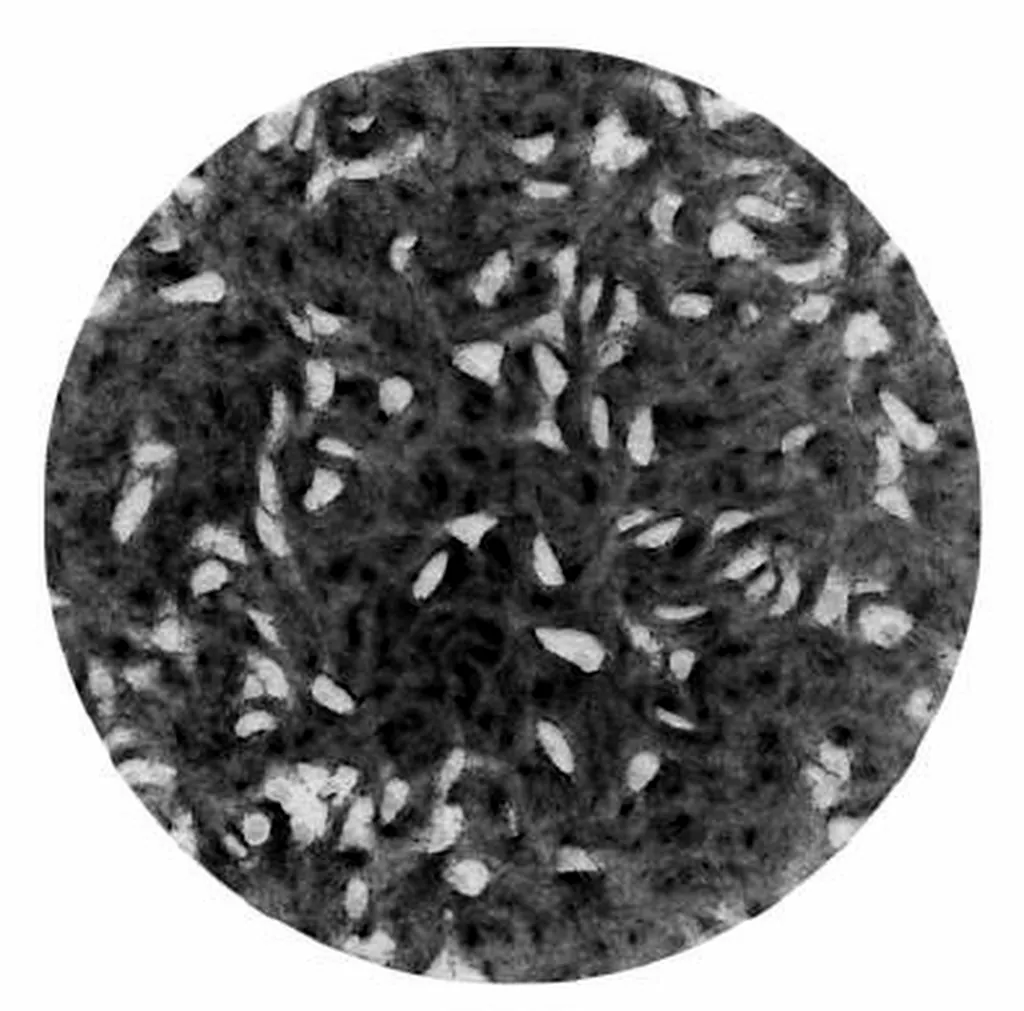
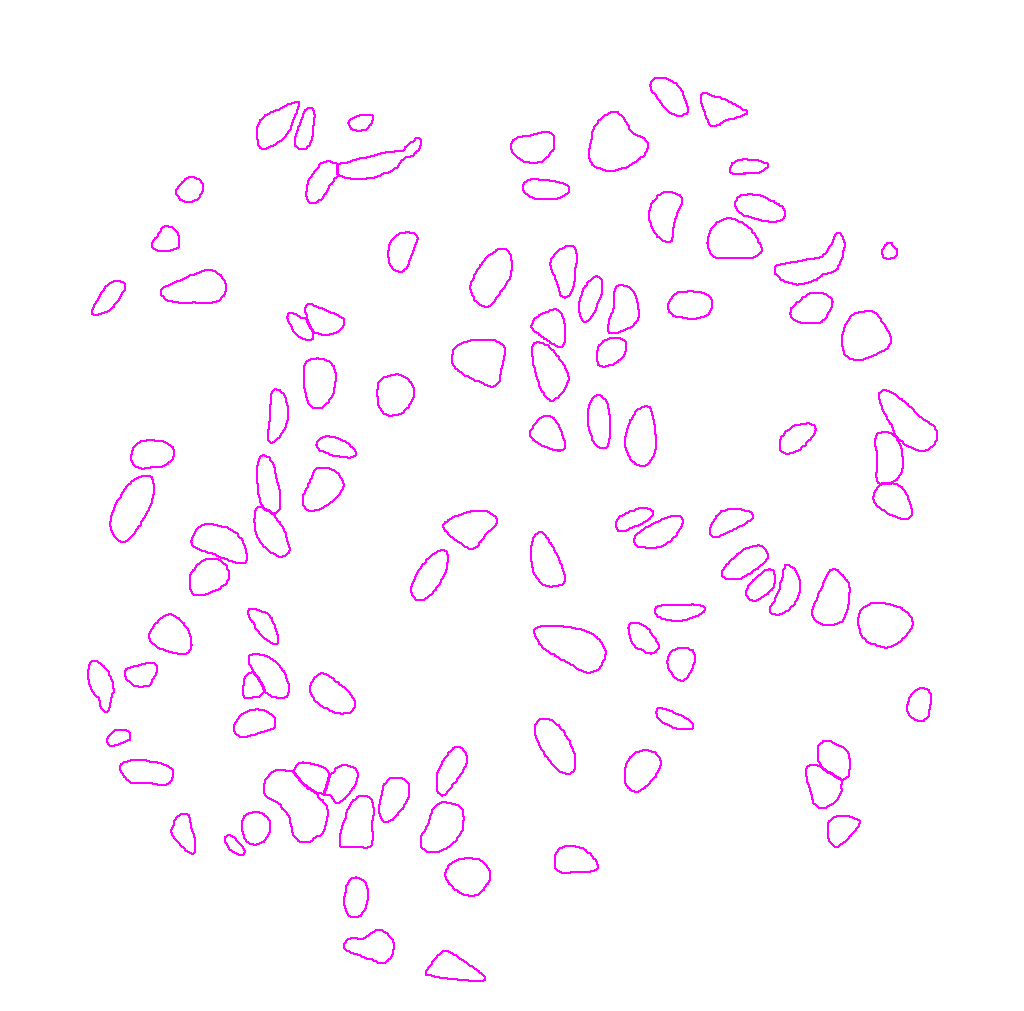
Hoechst image: nuclei, host cells and Toxoplasma
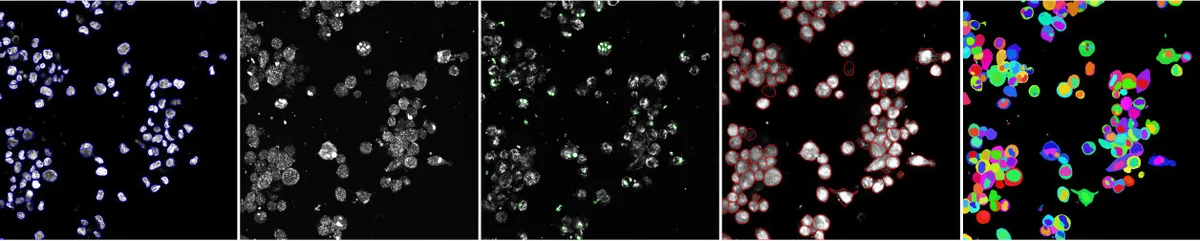
One Hoechst image of HeLa cells infected with Toxoplasma gondii. Host cells and parasite vacuoles are predicted from the Hoechst channel alone by two spaCR cross-channel models. Nuclei come from stock Cellpose-SAM on the same channel.
- Input
- Hoechst (nuclear stain)
- Image
- HeLa field, plate 1 well L08 field 12, test split (held out by well)
- Licence
- CC BY 4.0
- Size
- 2000 × 2000 px, shown at 1024 px
- Figure
- With caption and checksums
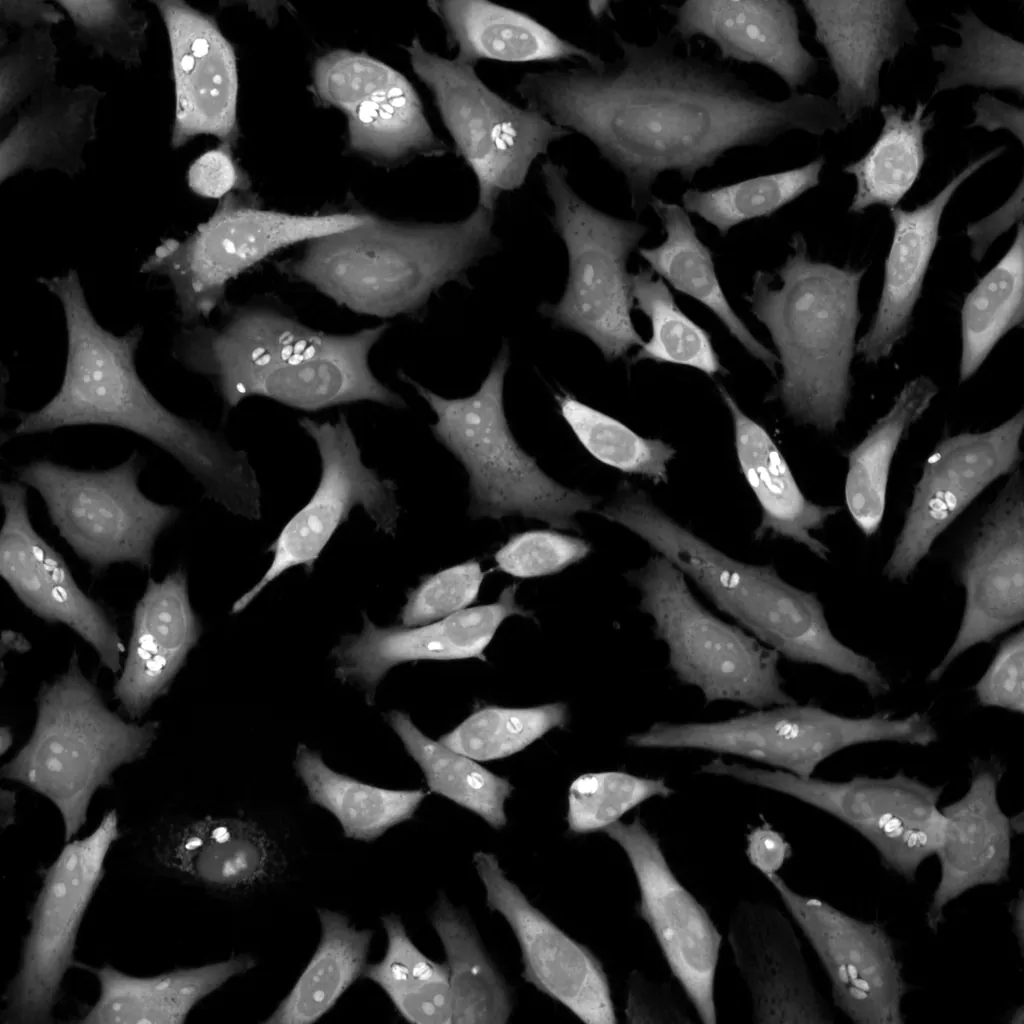
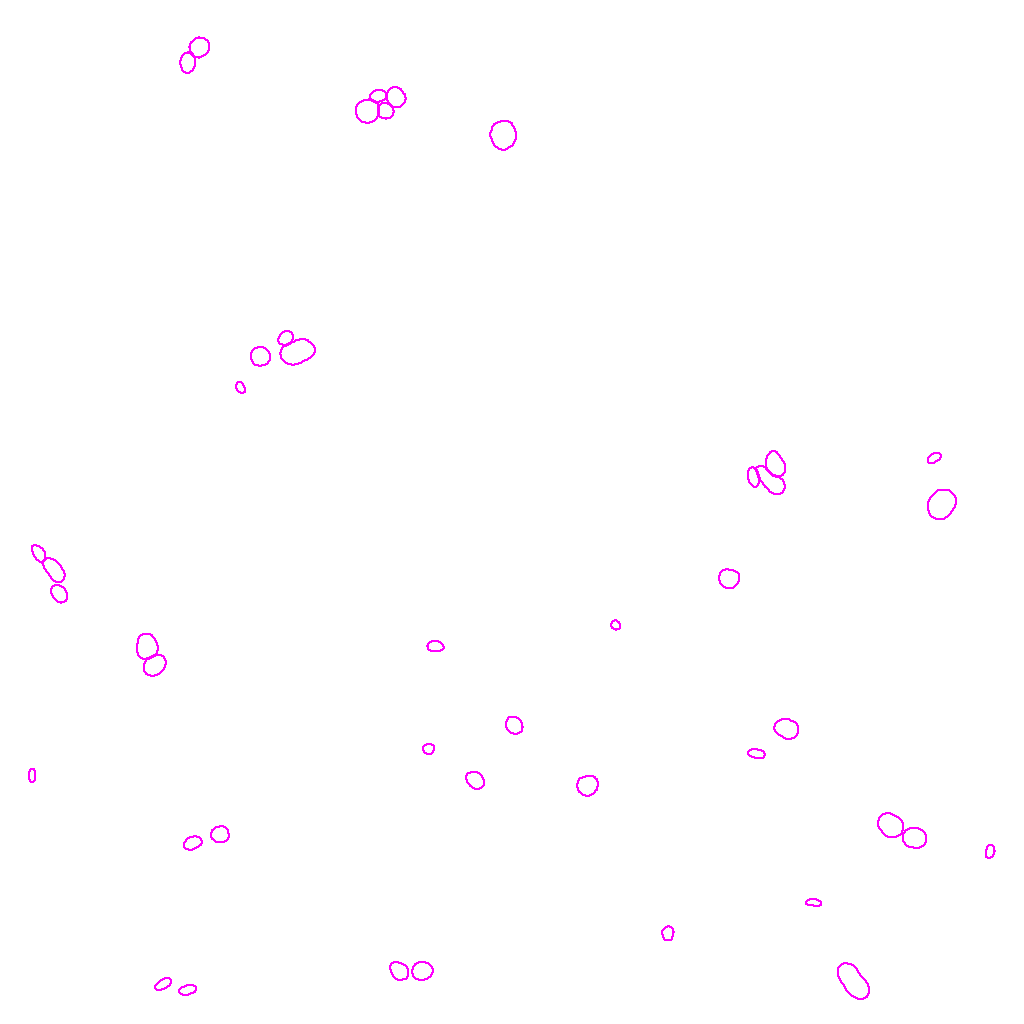
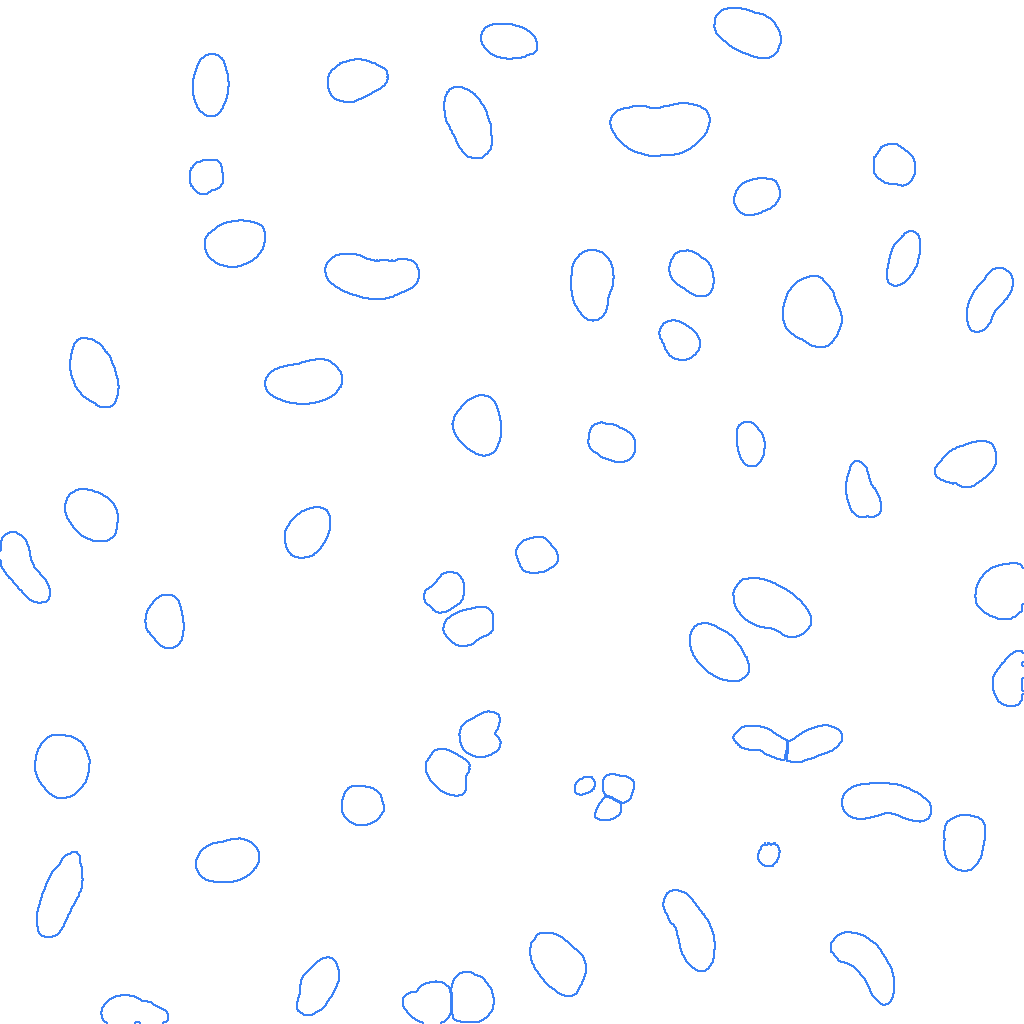
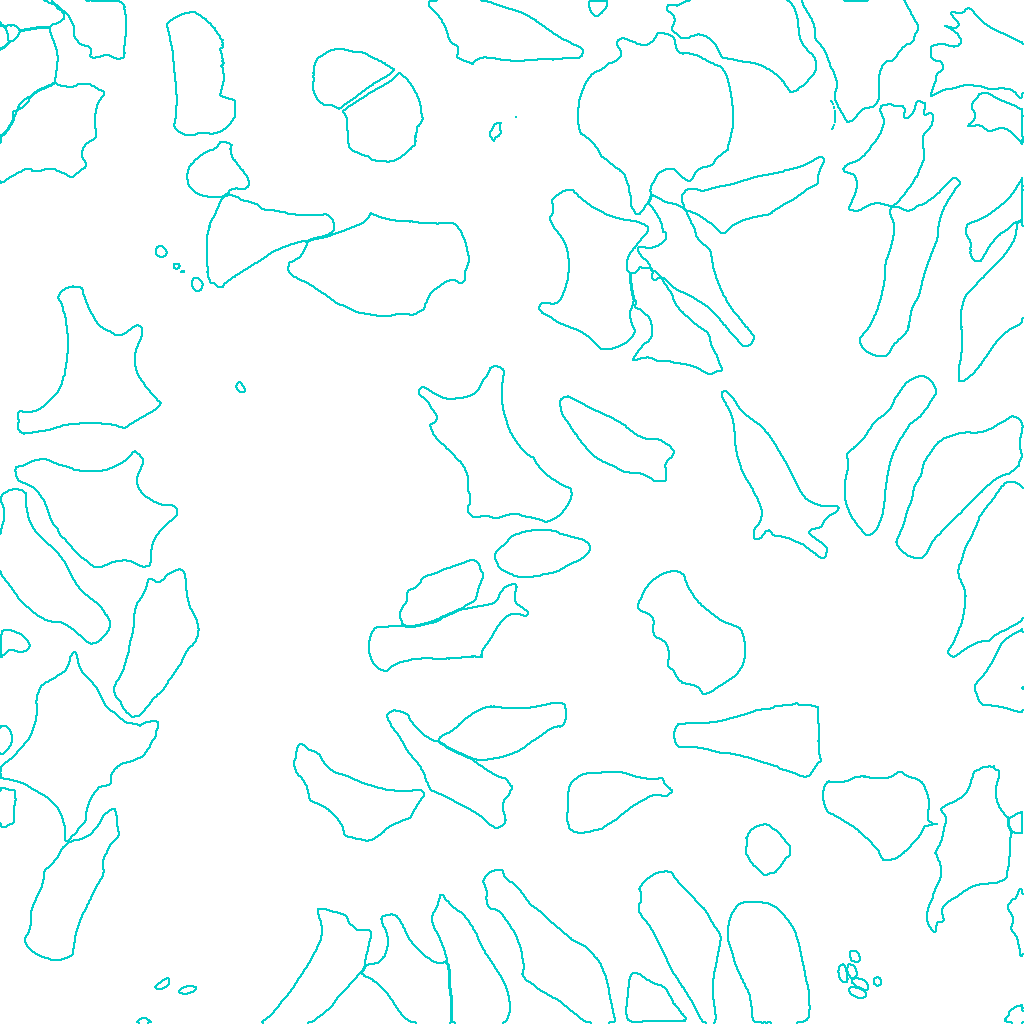
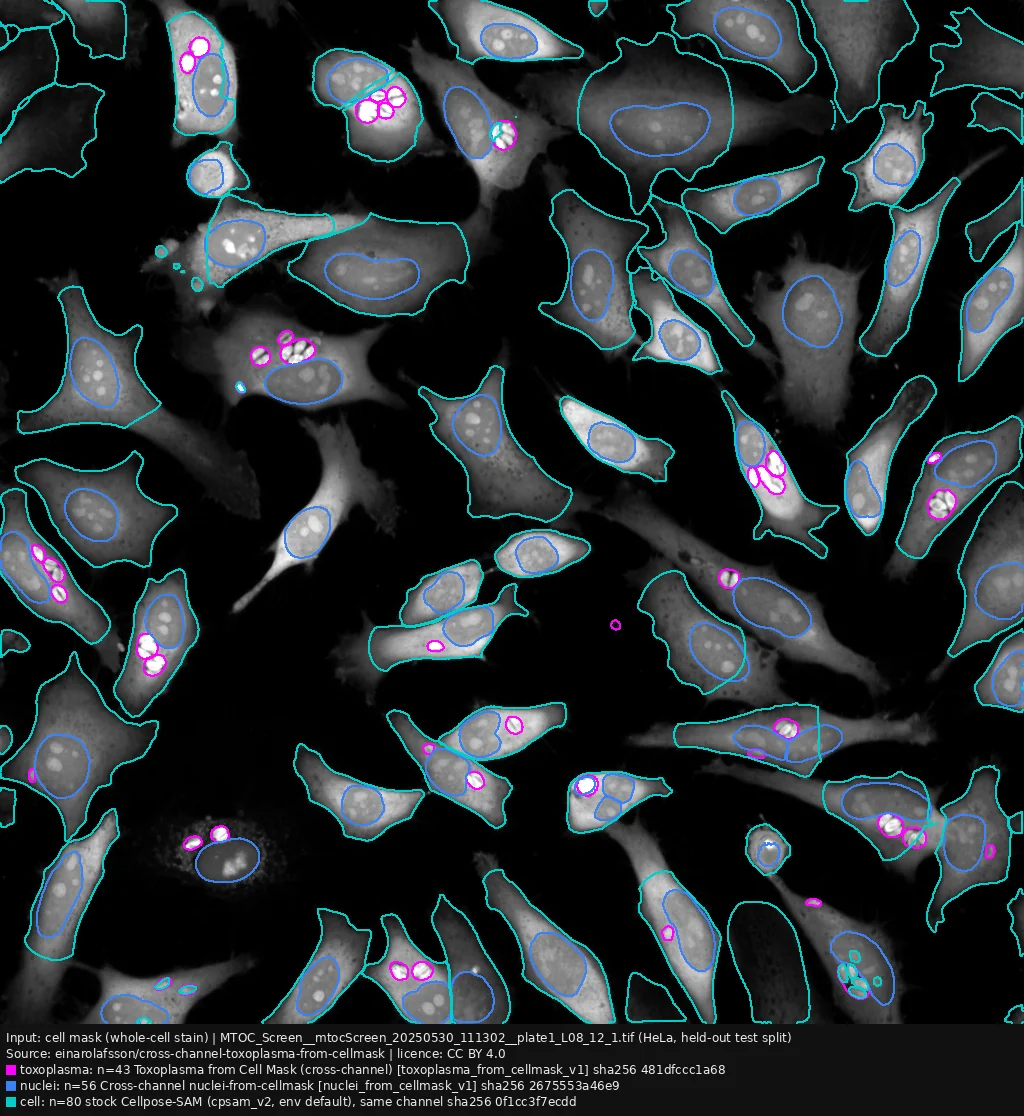
Cell-mask image: Toxoplasma, nuclei and host cells
The same field imaged with a whole-cell stain. Parasite vacuoles and nuclei are predicted from this channel alone by two spaCR cross-channel models, so no nuclear or parasite stain is needed. Host cells come from stock Cellpose-SAM on the same channel.
- Input
- Cell mask (whole-cell stain)
- Image
- HeLa field, plate 1 well L08 field 12, test split (held out by well)
- Licence
- CC BY 4.0
- Size
- 2000 × 2000 px, shown at 1024 px
- Figure
- With caption and checksums
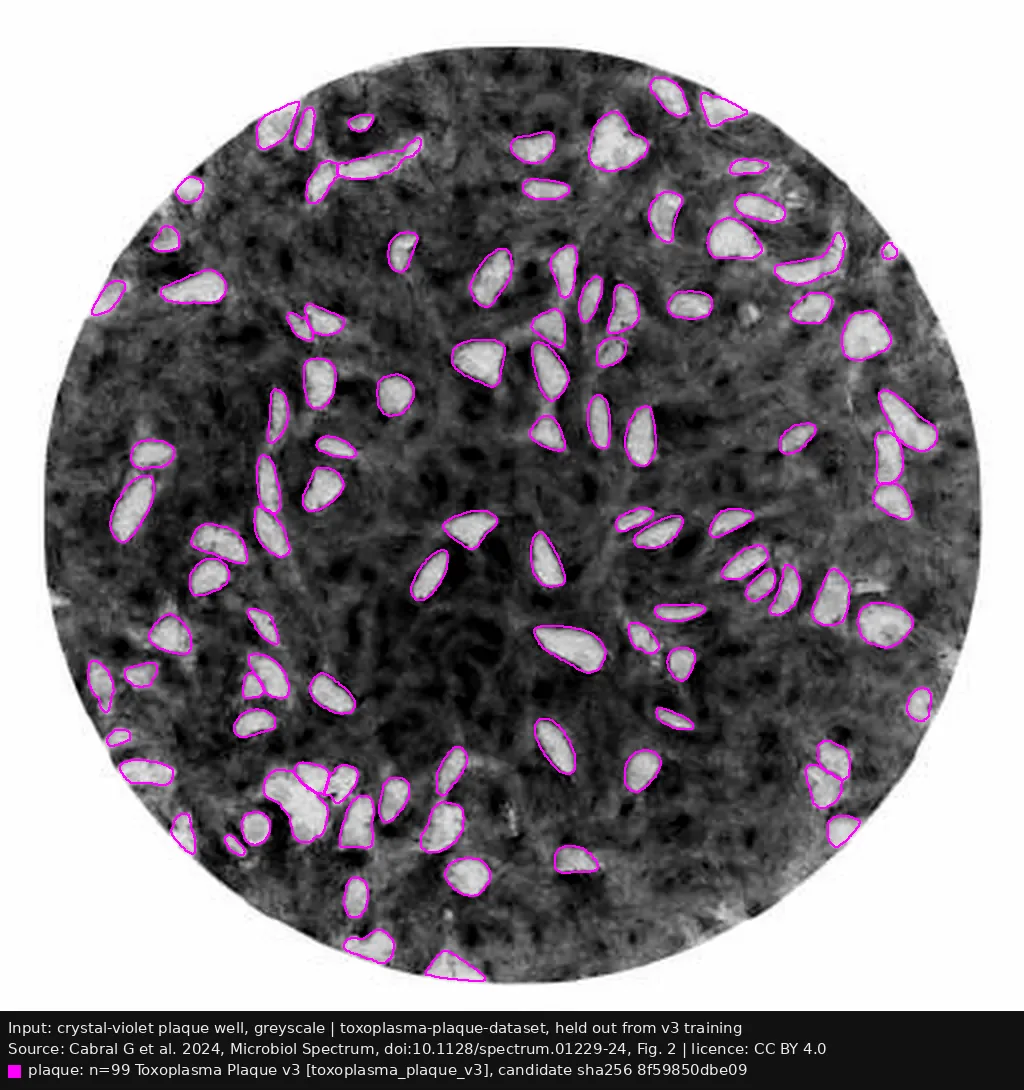
Plaque assay: Toxoplasma plaques
A crystal-violet plaque-assay well from a published figure. Plaques are segmented by spaCR's plaque model. This well was not used to train the model.
- Input
- Crystal violet, greyscale
- Image
- Cabral G, et al. Microbiol Spectrum 2024, Fig. 2
- Dataset
- toxoplasma-plaque-dataset (held out from v3 training)
- Licence
- CC BY 4.0
- Figure
- With caption and checksums
All models, with model cards, metrics and training data: model zoo documentation and Hugging Face.
Screen results
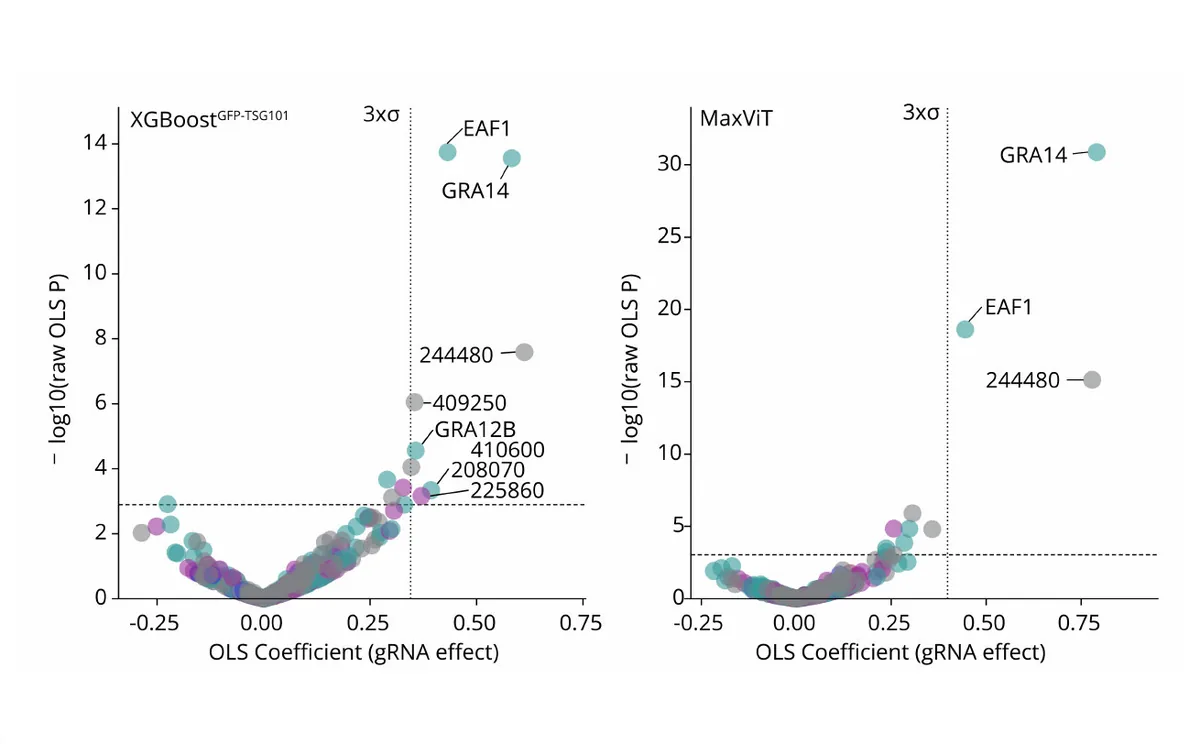
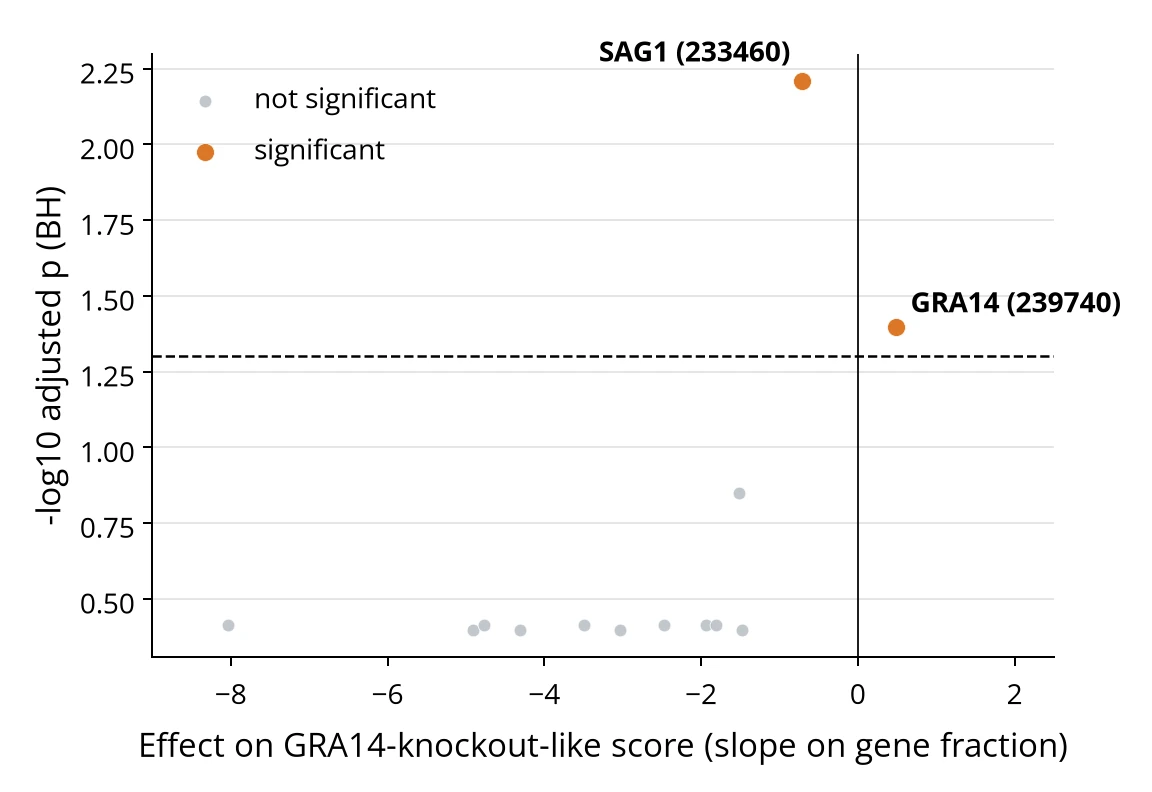
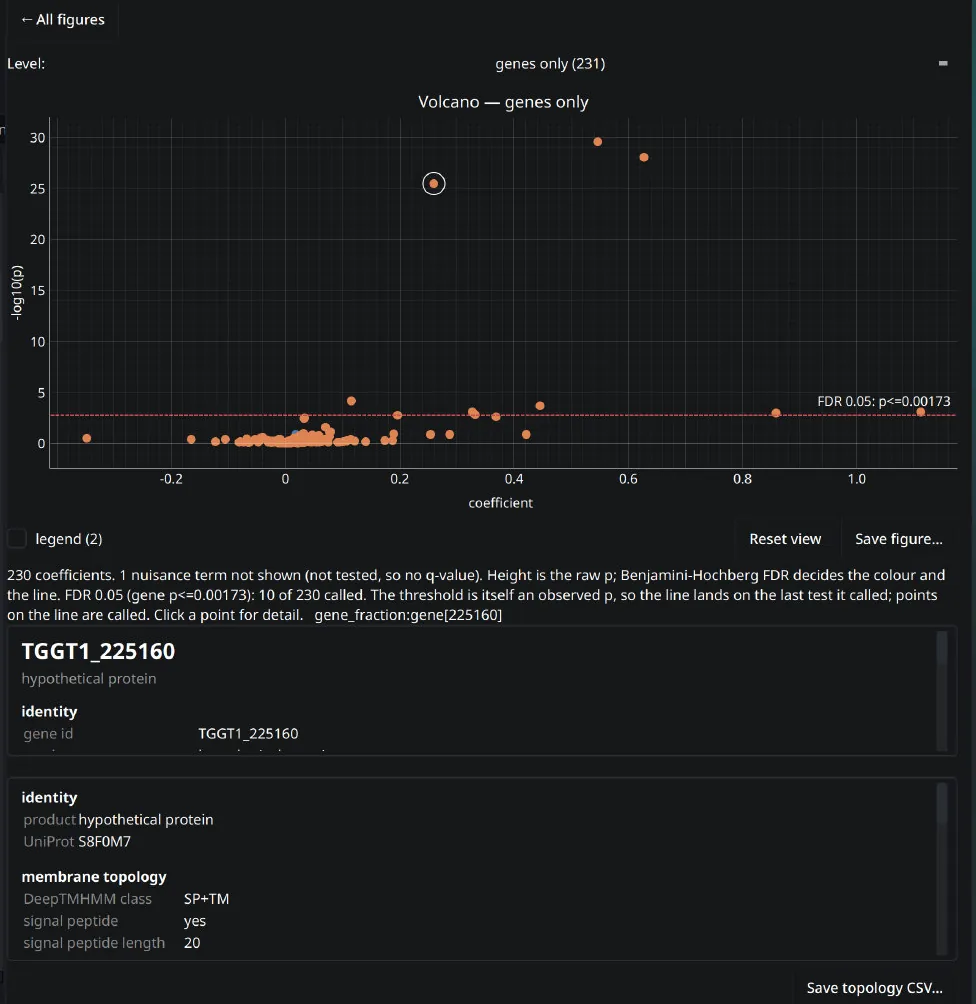
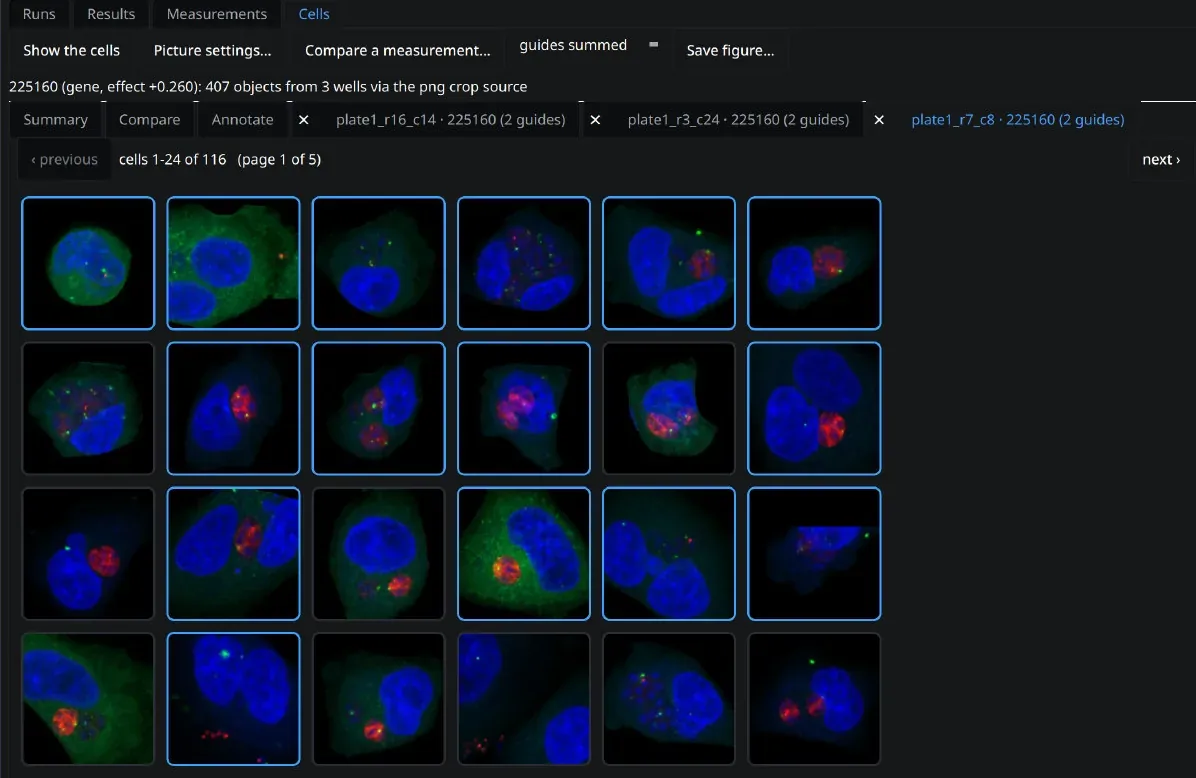
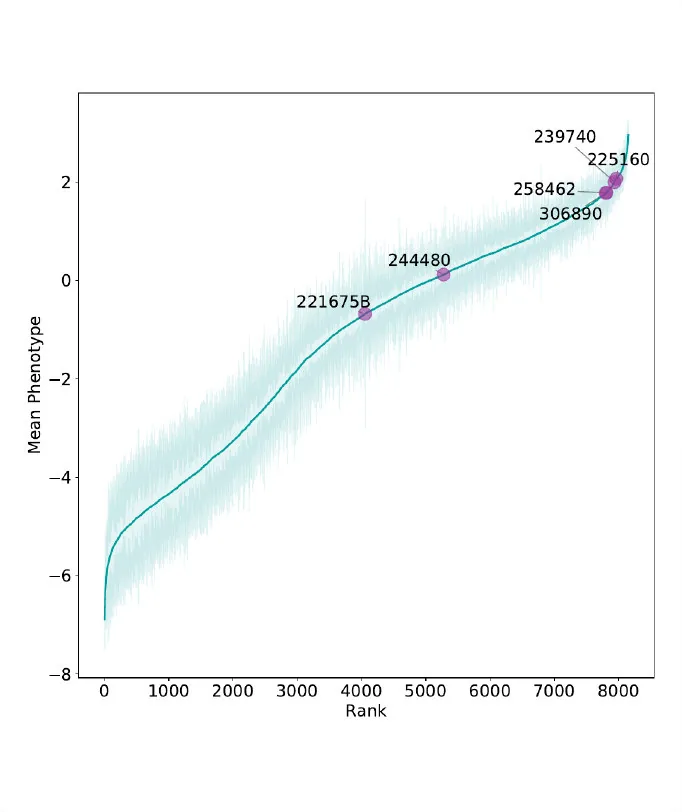
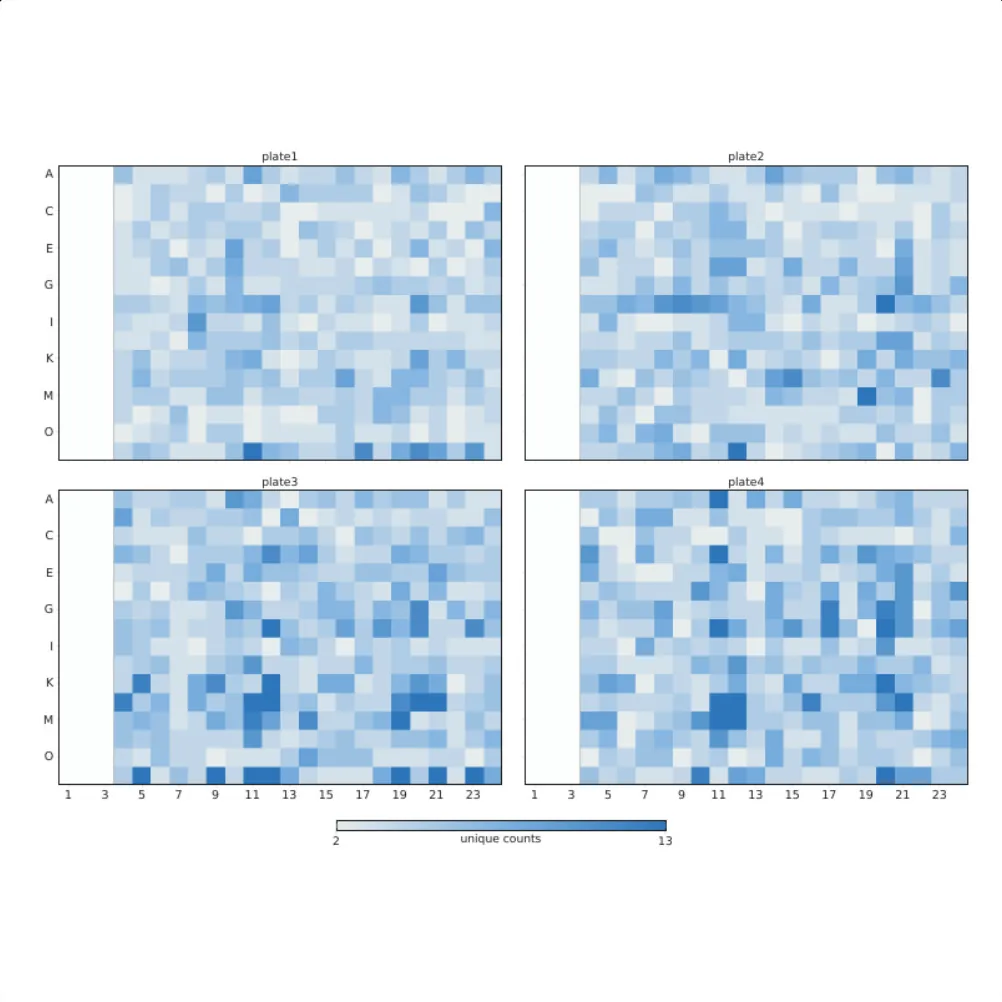
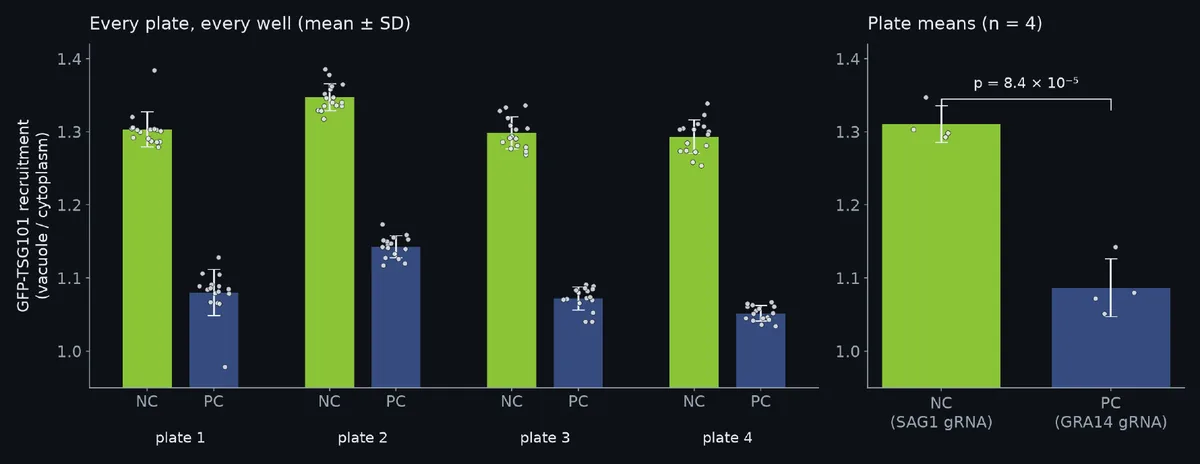
A pooled CRISPR screen in Toxoplasma gondii for parasite genes that affect recruitment of the host ESCRT protein GFP-TSG101 to the parasite vacuole, analysed with spaCR. From the spaCR preprint.
- 4screen plates
- 2genes past 3σ with both classifiers
- p 8.4 × 10⁻⁵GRA14 vs SAG1 recruitment
Phenotypes
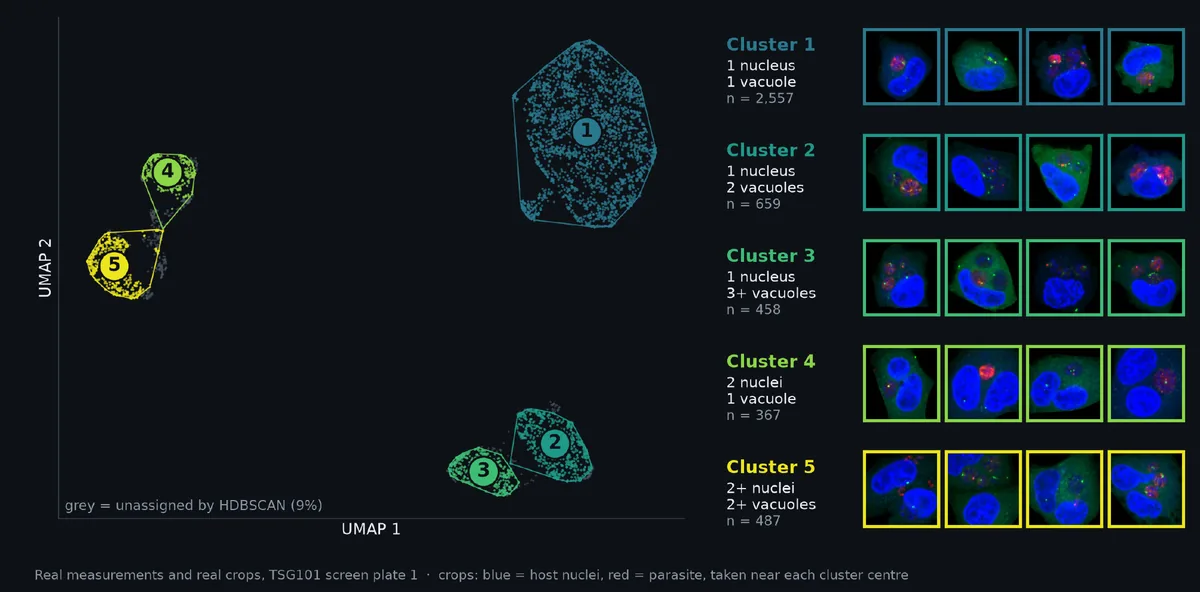
Every measured cell can be placed on a two-dimensional map with its image crop, so that groups of similar cells can be found and checked by eye.
- 5,000cells mapped
- 5clusters
- 9%unassigned
Assays and QC
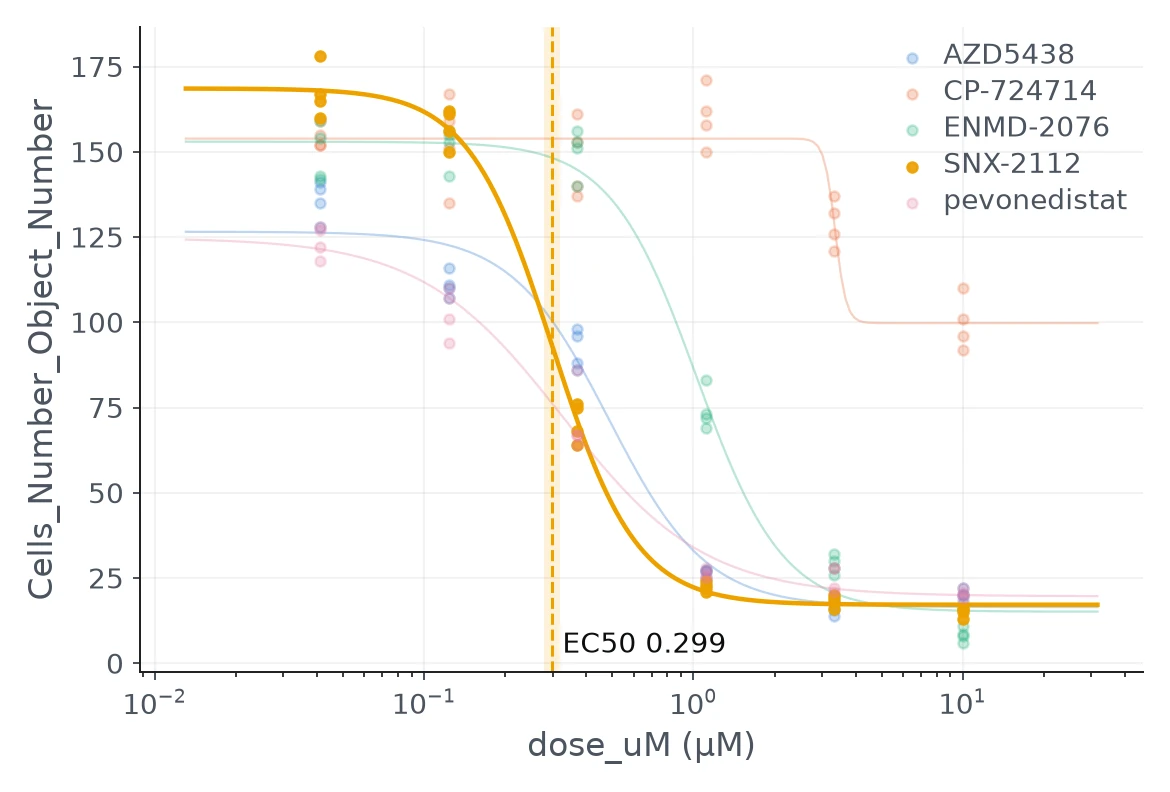
Outputs of spaCR's assay and quality-control modules on its public example data sets, computed on CPU.
- 1,536wells, dose-response
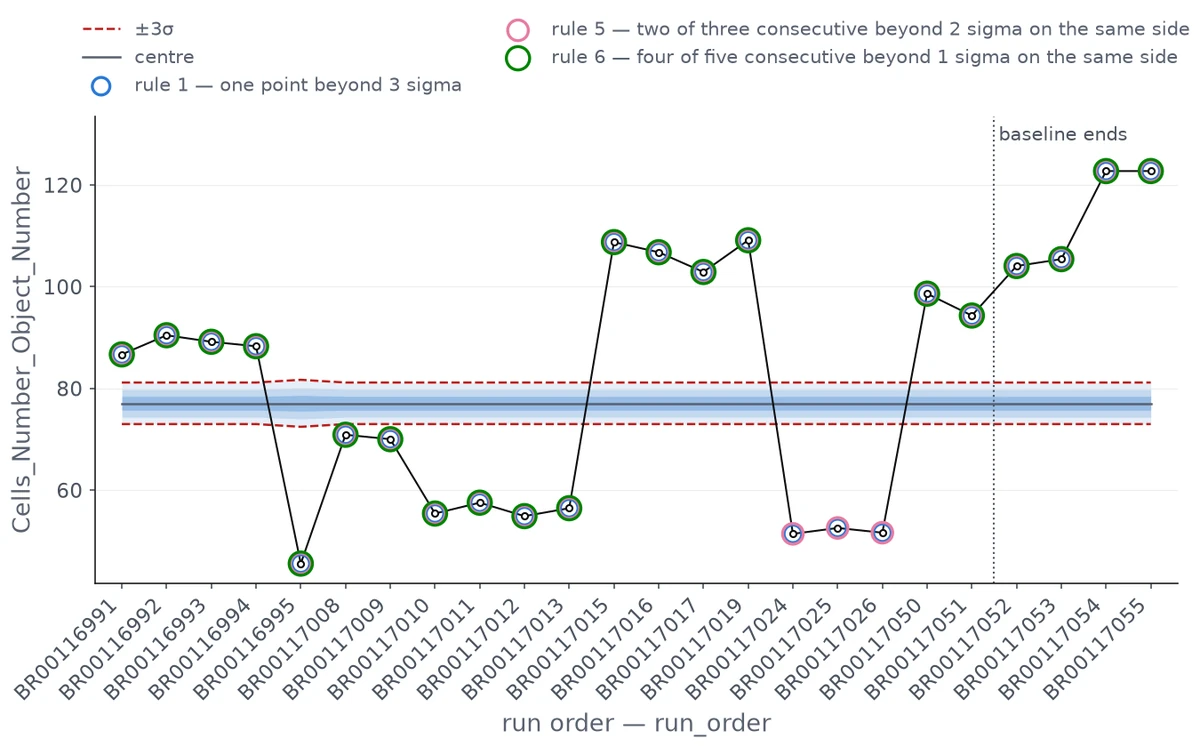
- 24plates, control chart
- 99plaques in one well
Papers using spaCR
Papers whose methods use spaCR, each checked in the full text; the quote under each entry is the evidence. Papers that only cite spaCR are not listed. Last checked 2026-10-10. To add a paper, open an issue.
- A pooled image-based CRISPR screen identifies EAF1 as a T. gondii modulator of ESCRT subversion Olafsson EB, et al. bioRxiv, 2026, preprint. The spaCR paper
-
 spaCR: Spatial phenotype analysis of CRISPR-Cas9 screens
Olafsson EB, et al. Research Square, 2025, preprint. The spaCR paper
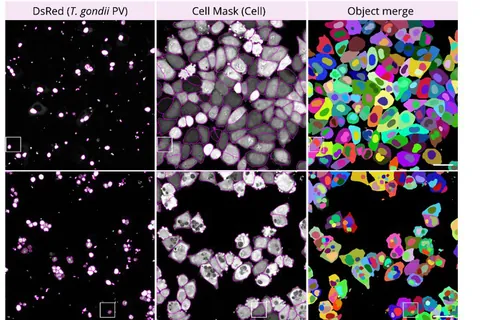
Image: Fig. 3 from Olafsson et al. Research Square 2025, CC BY 4.0 (cropped)
spaCR: Spatial phenotype analysis of CRISPR-Cas9 screens
Olafsson EB, et al. Research Square, 2025, preprint. The spaCR paper
Image: Fig. 3 from Olafsson et al. Research Square 2025, CC BY 4.0 (cropped)
-
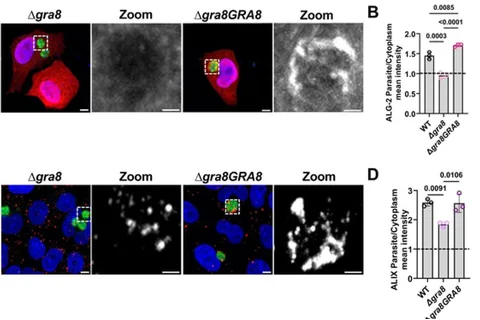 Toxoplasma GRA8 engages the host ESCRT accessory protein ALG-2 and is necessary for parasite metabolic integrity
Kaur H, et al. bioRxiv, 2026, preprint. Uses spaCR
Toxoplasma GRA8 engages the host ESCRT accessory protein ALG-2 and is necessary for parasite metabolic integrity
Kaur H, et al. bioRxiv, 2026, preprint. Uses spaCR
Image: Fig. 4 from Kaur et al. bioRxiv 2026, CC0 1.0 (cropped)All quantitative image analysis was performed as described in (33) in detail.
Methods, ESCRT protein recruitment -
IRE1α promotes phagosomal calcium flux to enhance macrophage fungicidal activity
McFadden MJ, et al. Cell Reports, 2025. Uses spaCR. Preprint: bioRxiv 2023
For analysis of cellular calcium flux, the Python package spacr (https://github.com/EinarOlafsson/spacr) was used to segment and track cells over time and quantify single cell calcium oscillations.
STAR Methods, 'Quantification of calcium flux' -
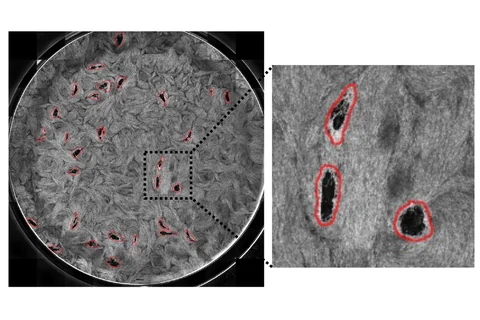 Metabolic adaptability and nutrient scavenging in Toxoplasma gondii: insights from ingestion pathway-deficient mutants
Rimple PA, et al. mSphere, 2025. Uses spaCR. Preprint: bioRxiv 2024
Metabolic adaptability and nutrient scavenging in Toxoplasma gondii: insights from ingestion pathway-deficient mutants
Rimple PA, et al. mSphere, 2025. Uses spaCR. Preprint: bioRxiv 2024
Image: Fig. S3 from Rimple et al. mSphere 2025, CC BY 4.0 (cropped)Plaques were detected and quantified using the plaque assay module in SpaCR (v. 0.3.62, https://github.com/EinarOlafsson/spacr and https://pypi.org/project/spacr/). First, plaques were manually …
Methods, 'Validation of screens'
Install spaCR 1.5.1.4
Desktop installers
The installers include their own Python, so Conda is not needed. Files from the v1.5.1.4 release.
-
 Windows 10 and 11
spaCR-1.5.1.4-Windows-Online-Setup.exe
Download 244 kB
Windows 10 and 11
spaCR-1.5.1.4-Windows-Online-Setup.exe
Download 244 kB
-
 macOS 11 or later, Intel and Apple silicon
spaCR-1.5.1.4-macOS-Universal-Online.pkg
Download 390 kB
macOS 11 or later, Intel and Apple silicon
spaCR-1.5.1.4-macOS-Universal-Online.pkg
Download 390 kB
-
 Linux x86-64
spaCR-1.5.1.4-Linux-x86_64-Online.run
Download 236 kB
Linux x86-64
spaCR-1.5.1.4-Linux-x86_64-Online.run
Download 236 kB
Checksums: SHA256SUMS.txt. Older installers and troubleshooting: installer documentation.
PyPI
conda create -n spacr python=3.12 -y
conda activate spacr
python -m pip install spacr==1.5.1.4
spacrconda-forge
conda create -n spacr python=3.12 -y
conda activate spacr
conda install conda-forge::spacr
spacrspaCR on PyPI · spaCR on conda-forge · Requires Python !=3.14.1,<3.15,>=3.9
Cite spaCR
Olafsson EB, Arnold CS, Kellermeier JA, Rimple PA, Kaur H, Wang Y, Sexton JZ, Svärd S, Carruthers VB, O'Meara MJ. spaCR: spatial phenotype analysis of CRISPR-Cas9 screens (version 1.5.1.4). Zenodo; 2026. doi:10.5281/zenodo.23266544
| All versions (concept DOI) | 10.5281/zenodo.21343316 |
|---|---|
| Version 1.5.1.4 | 10.5281/zenodo.23266544 |
| Preprint | 10.64898/2026.07.08.737057 |
| Metadata | CITATION.cff |
BibTeX
@software{olafsson_spacr_2026,
  author    = {Olafsson, Einar B. and Arnold, Christophe-Sebastien and Kellermeier, Jacob A. and Rimple, Patrick A. and Kaur, Hargobinder and Wang, Yifan and Sexton, Jonathan Z. and Svärd, Staffan and Carruthers, Vern B. and O'Meara, Matthew J.},
  title     = {{spaCR: spatial phenotype analysis of CRISPR-Cas9 screens}},
  version   = {1.5.1.4},
  year      = {2026},
  publisher = {Zenodo},
  doi       = {10.5281/zenodo.23266544},
  url       = {https://doi.org/10.5281/zenodo.23266544}
}Documentation
The desktop application
Muted excerpts from the narrated tutorials. The full lessons, with narration and captions in several languages, are in the tutorial portal.